How to Check for a Bottleneck on Your PC
Two tests identify your limiting component in minutes, without installing anything. Plus how to read CPU and GPU utilisation correctly.
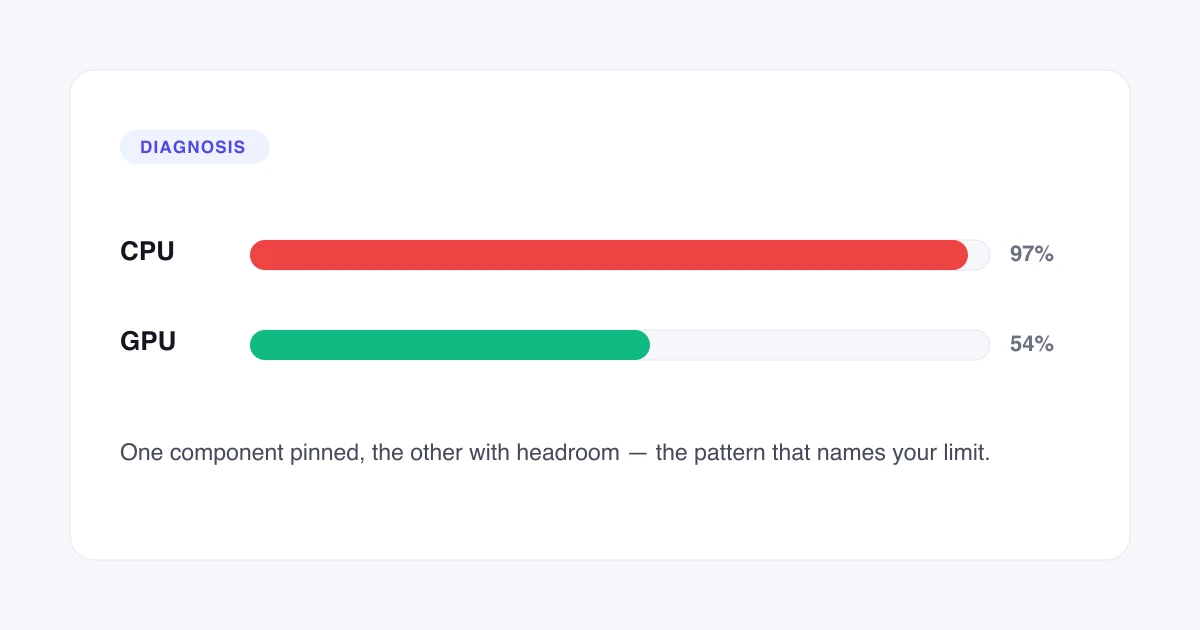
Checking for a bottleneck on a PC takes two changes to your game settings and no software at all. Lower the resolution, then lower the graphics settings. If the frame rate barely moves either time, your CPU is the limiting component. If the frame rate climbs, your GPU was.
The Fastest Check Needs No Software
The fastest check is a settings change, not an installation. You can identify your limiting component in two minutes without installing anything, and the two tests that follow are more conclusive than a first look at a monitoring overlay.
Both tests rest on one mechanism. Lowering resolution or graphics settings reduces the work your GPU does per frame while leaving the work your CPU does per frame roughly unchanged. A GPU given less to do finishes sooner and the frame rate rises. A CPU given the same amount to do finishes at the same time, so the frame rate stays where it was.
Test 1 — Lower the resolution
- Start the game you care about and reach a scene you can return to reliably. A repeatable scene matters more than a demanding one.
- Note the frame rate at your normal resolution. The in-game counter is accurate enough.
- Drop the resolution one step, such as 1440p to 1080p. Change nothing else.
- Return to the same scene and note the frame rate again.
The test that settles it
- Lower the resolution
- Frame rate rises
- What that tells you
- Graphics work was the constraint
The graphics card was the limit
Illustration of the mechanism, not measured data.
A frame rate that barely moves means your CPU is the limiting component. Fewer pixels gave the GPU less work, and the frame rate did not improve, so the GPU was not what you were waiting for. A frame rate that climbs roughly in proportion to the pixel count means the GPU was the limit.
Test 2 — Lower the graphics settings
- Restore your normal resolution.
- Drop the graphics preset one step, from High to Medium as an example. Leave the resolution alone.
- Return to the same scene and note the frame rate a third time.
The reading works the same way: little movement points at the CPU, a clear climb points at the GPU.
Running both tests rather than one is worth the extra minute, because the two changes reduce different kinds of GPU work. Resolution scales how many pixels the GPU shades. Graphics settings scale how much work each pixel costs. A game can respond clearly to one and barely to the other, and a single test can therefore mislead you where two together do not.
How Do You Read CPU and GPU Utilisation?
Reading CPU and GPU utilisation means comparing the two figures against each other. Neither figure means anything alone, because high utilisation is the goal on one component and a warning on the other.
Both figures are available without extra software. Windows Task Manager reports CPU utilisation and GPU utilisation on its Performance tab, and most graphics drivers include an overlay that reports both alongside the frame rate. A component at maximum rarely reads exactly full, so treat a figure that stops climbing when you add load as saturated.
Overall CPU utilisation carries one trap worth knowing before you read the table. A CPU reports utilisation averaged across every core, and games rarely load every core equally. On a processor with many cores, a single thread running flat out can leave the overall figure looking comfortable while that one thread sets your frame rate. Where your monitoring tool offers a per-core view, use it: one core pinned while the rest idle is a CPU limit, whatever the combined figure says.
| Pattern | What it means | What to do |
|---|---|---|
| Both low | A frame cap, a refresh-rate ceiling or a menu is the limit, not a component | Raise or remove the cap before testing further |
| CPU low, GPU at maximum | GPU-limited, the preferred state in a game | Nothing; lower settings only if you want more frames |
| CPU high, GPU at maximum | Both working hard, GPU still the limit | Nothing; the pair is well matched |
| CPU at maximum, GPU low | CPU-limited, the case that ignores your settings | Reduce CPU load or plan a CPU upgrade |
| CPU at maximum, GPU high | CPU-limited but close to balanced | Tune settings first; upgrade later |
| Both at maximum | Both saturated, the limit alternates frame to frame | Treat the named component from the calculator as the priority |
What each CPU and GPU utilisation pattern indicates, and the action it calls for.
Why Average Utilisation Misleads You
Average utilisation hides the spikes that cause stutter. Every utilisation readout is an average taken over a sampling interval, and a spike shorter than that interval disappears into the figure.
A CPU can average well below its ceiling and still stall individual frames. Game engines do not spread work evenly across cores: they load a few threads heavily and leave others nearly idle. One saturated thread barely moves an overall average, and it still delays the frame that depends on it.
Frame-time consistency is the measurement that exposes this, and 1% low frame rates are the practical form of it. A 1% low frame rate is the average of the slowest one percent of frames in a session, so it describes your worst moments rather than your typical ones. A stuttery 90 frames per second and a smooth 90 frames per second report the same average. The spread between your typical frame and your slowest frames is what separates them.
Frame time is the better unit for this work, because frame time is linear where frame rate is not. Frame time is the duration of a single frame in milliseconds. Moving from 30 to 60 frames per second removes 16.7 ms from every frame; moving from 120 to 240 removes 4.2 ms. Both are a doubling, and the first is four times the change in the quantity your eyes actually respond to.
That non-linearity is why a frame rate graph flatters a stuttering machine. A single frame that takes four times as long as its neighbours barely dents a per-second average, and it is plainly visible as a spike on a frame-time graph. If your averages look healthy and the game does not feel healthy, the average is not the measurement you need.
What Should You Monitor, and For How Long?
Monitor during real play, for long enough to include the moments that stress the machine. A benchmark loop and a menu screen both produce clean figures that describe nothing you will experience.
Two kinds of tool answer two different questions. A monitoring overlay shows CPU utilisation, GPU utilisation and frame rate live, which is enough to identify which component is saturated. A frame-time logger records the duration of every frame, which is what you need when the averages look healthy and the game does not feel it.
Sampling interval matters more than most guides admit. A one-second interval smooths away the spikes you are hunting; a shorter interval keeps them. Set the shortest interval your tool offers before deciding that a machine has no stutter problem.
Record four things together: CPU utilisation, GPU utilisation, frame rate and frame time. The first three identify which component is saturated; the fourth is the one that explains stutter, and it is the one most overlays leave switched off by default.
Watch for several minutes of ordinary play, and include the parts of a game that change character: traversal across a large map, a crowded street, the first seconds after a new area loads. Those moments load the CPU differently from a static scene, and they are where a CPU limit reveals itself.
Discard the first minute or two of a fresh session. A game starting for the first time on a new driver compiles shaders while you play, which loads the CPU in a way that has nothing to do with the frame it is preparing. Judging a machine on that window produces a CPU limit that will not be there on the second run.
What Does Your Result Mean, Component by Component?
Your result names a component, and the name is the more useful half of the answer. It tells you which part runs out of capacity first, and therefore which part responds to money or tuning. The component that is not named has spare capacity the named one cannot reach, which is why upgrading it changes nothing.
Each component also fails in a recognisable way, and the symptom is often faster to read than any figure. Match what you are seeing against the symptom for each component before spending anything.
- CPU — frame rate ignores your graphics settings, and stutter arrives before the average frame rate drops. The CPU bottleneck calculator covers which specification is the constraint.
- GPU — frame rate responds to settings and resolution in proportion. Checking whether your graphics card is limited separates a compute limit from a memory limit, which need different fixes.
- RAM — stutter and hitching while both CPU and GPU utilisation look healthy. The RAM bottleneck calculator names which of capacity, speed or channel configuration is binding.
- Storage — long loading, texture pop-in and stutter when crossing a map, with steady frame rates otherwise. The storage bottleneck calculator sets out what a drive does and does not change.
- Monitor — a frame rate that stops exactly at a round number is a refresh ceiling. The monitor bottleneck calculator explains why frames above your refresh rate still help.
For a number rather than a pattern, the bottleneck calculator compares a specific pair at your resolution, and the methodology sets out what the estimate can and cannot see. The arithmetic behind that percentage is covered in how to calculate CPU and GPU bottleneck, and the two limits are set side by side in CPU vs GPU bottleneck.
Three Things People Misdiagnose as a Bottleneck
Three failure modes look like a bottleneck and are not. Each one has a different fix, and none of them responds to a component upgrade.
Shader compilation stutter appears in the first minutes with a new game, a new driver or a new area. The game is compiling shaders while you play, which loads the CPU in bursts unrelated to the frame it is preparing. The stutter fades as the shader cache fills. Wait it out, or use a pre-compilation option where the game offers one.
Thermal throttling looks like a bottleneck that gets worse the longer you play. A component near its temperature limit reduces its own clocks to stay there, so frame rates start acceptable and decline. The signature is time, not scene: the same spot runs slower after twenty minutes than after two. Check temperatures across a long session before blaming a part.
A frame cap or refresh ceiling produces low utilisation on both components at once, which no genuine bottleneck does. A frame rate sitting exactly at 60, 120 or 144 and refusing to move is a cap, whether from V-Sync, a driver limit or an in-game setting. Remove the cap before running either test, or both tests will report nothing.
None of the three responds to a faster CPU or a faster GPU, which is what makes them worth ruling out first. As of July 2026 the fastest way to separate them from a real limit is the pattern each one leaves: shader stutter fades, throttling worsens with time, and a cap holds both components below saturation at once.